How Much Will Your Solar Panels Actually Generate? Our New Monthly Estimator
Knowing your annual figure is useful. Knowing how that breaks down month by month is far more useful.
One of the most common questions from people thinking about getting solar panels installed is simply: how much electricity will my panels actually produce?
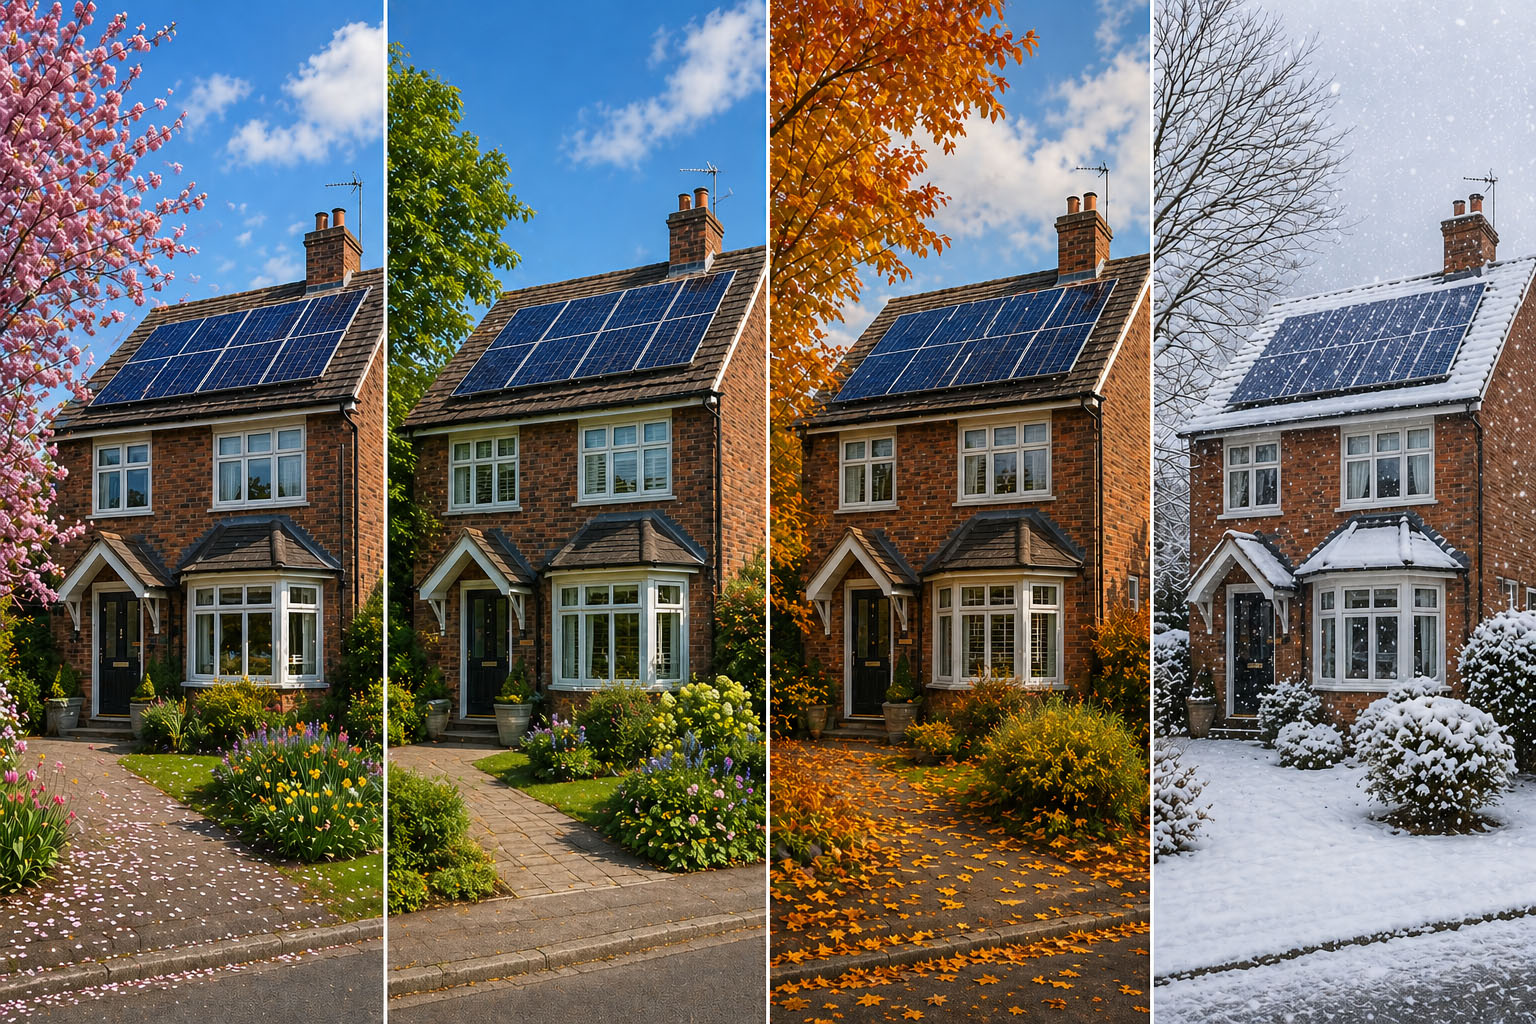
Most installers will quote you an annual figure. Something like “a 4kWp system in the Midlands will generate around 3,400 kWh per year.” Whilst that number may be accurate, it doesn’t provide the full picture of when you’ll actually get that energy. It doesn’t tell you that roughly 56% of that generation happens in just four months of the year, or that December might produce less than 3% of your annual total, or that by March you’re already approaching 80% of peak summer output.
That uneven distribution matters as it can affect how you plan your energy use, whether a battery is worth considering, how quickly you’ll reach payback, and what to realistically expect during those grey November weeks when the monitoring app makes for depressing reading.
That’s why we’ve built the Solar Generation Estimator.
What the tool does
Enter your system size, UK region, roof orientation, roof pitch, and shading level, and the estimator breaks your annual generation down month by month.
You get:
- A bar chart showing the full generation curve across the year
- Your estimated annual total in kWh
- Your best and worst months, with figures
- The ratio between your summer and winter quarters
- A full monthly table with daily averages and each month’s share of the year
The monthly distribution is built from PVGIS-calibrated irradiance data for UK conditions, with a performance ratio of 0.85 applied consistently across the calculation. The same figures used by your installer when they quote your expected yield.
Why the monthly shape matters more than the annual total
Here’s a real example. The table below shows actual generation from a 4.89kWp system in the north of England across a full annual cycle from April 2025 to March 2026:
| Month | kWh |
|---|---|
| Jan | 84 |
| Feb | 118 |
| Mar | 317 |
| Apr | 473 |
| May | 547 |
| Jun | 578 |
| Jul | 559 |
| Aug | 494 |
| Sep | 347 |
| Oct | 167 |
| Nov | 117 |
| Dec | 68 |
June produced 578 kWh. December produced 68 kWh. That’s an 8.5:1 ratio between the best and worst months.
If you only ever looked at the annual total of around 3,870 kWh, you’d have no feel for this shape. But the shape is exactly what determines whether a battery pays off, how much grid electricity you’ll still need in winter, and whether your self-consumption assumptions hold up throughout the year.
How it connects to your other calculations
The Solar Generation Estimator works alongside the other tools on the site. If you’ve already used the System Size Calculator or the Solar ROI Calculator, the generation figures feed directly into those calculations. The estimator gives you the monthly picture that sits behind the annual totals you’ve already seen.
It also pairs naturally with the Self-Sufficiency Calculator. Your self-sufficiency figure will look very different in June versus January, and understanding that seasonal swing helps you make better decisions about battery sizing and consumption habits.
A note on the figures
These are estimates, not guarantees. Real-world generation varies with weather, panel degradation over time, inverter efficiency, and how accurately you’ve described your shading situation. A heavily shaded south-facing roof can produce less than a lightly shaded east-facing one.
What the tool gives you is a realistic baseline grounded in UK irradiance data rather than optimistic sales projections. If your installer’s quoted figures are meaningfully higher than what the estimator produces for your inputs, that’s worth querying.