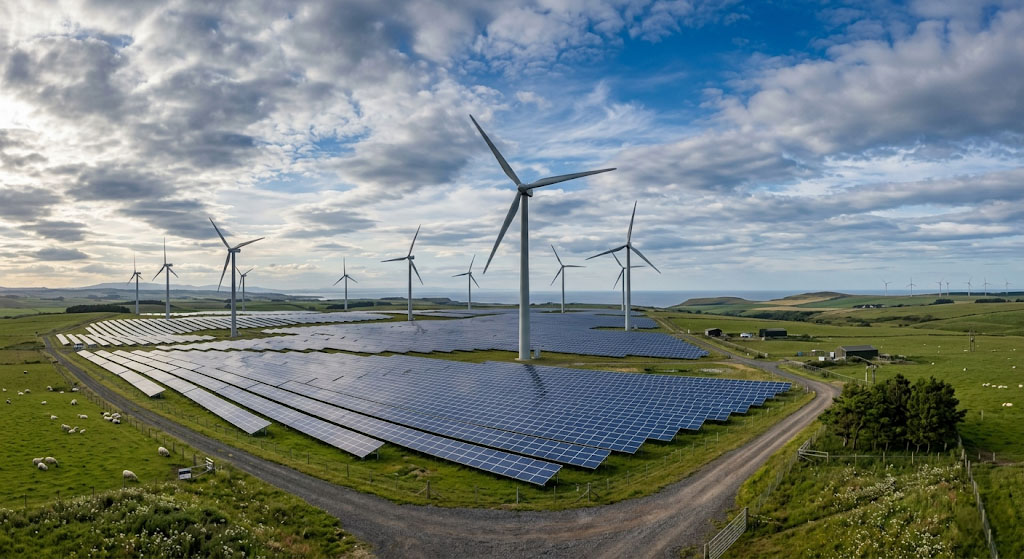
You’ve probably heard the argument. Maybe from a relative at Christmas, maybe in a comment section, maybe from a politician making a case against wind farms. The claim takes different forms but the core of it is always the same: renewable energy is too unreliable and insufficient to meet Britain’s electricity needs. We need gas. We need coal. We can’t run a modern country on sunshine and wind.
There’s just one problem. The data says otherwise.
What the numbers actually show
Every month, the National Energy System Operator (NESO), the organisation responsible for keeping Britain’s lights on, publishes a breakdown of where our electricity came from. It’s publicly available, independently verified, and not produced by an environmental lobby group. It’s produced by the people who operate the grid.
National Grid: Live, built by developer Kate Morley using NESO data, makes this history navigable for anyone. It covers the full generation record back to 2012, broken down by source, and updated every half hour. Anyone can check it. Here’s what it shows.
2012 – present
May 2025 – Apr 2026
30 Apr 2026, 10:45am
"Today" snapshot reflects live data from National Grid: Live at time of writing and will vary. The all-time and past-year averages are stable rolling figures from the same source.
Renewables, wind, solar, hydro, and biomass, generated 52.5% of the UK’s electricity in 2025, according to DESNZ Energy Trends figures. That’s the highest share ever recorded, and the second consecutive year in which renewables have supplied more than half of Britain’s electricity.
The coal story is already over
If you want a concrete example of how fast things have changed, consider coal.
In 2012, coal provided around 40% of Britain’s electricity. For most of the 20th century it was the backbone of the national grid. The idea that you could run the country without it would have seemed as unlikely as some think about gas today.
Britain’s last coal-fired power station closed in September 2024. 2025 was the UK’s first full year without any coal generation at all. That transition happened. It wasn’t theoretical and the lights stayed on.
Wind: the numbers that matter
The pace of wind capacity growth is the part of this story that doesn’t get told often enough.
In December 2016, British wind farms first sustained 10 GW of generation. By December 2025, the record stood at nearly 24 GW - more than double in nine years. On 5 December 2025, wind alone met 52% of GB demand for half an hour.
New records at this scale aren’t flukes or “favourable weather”. They reflect a grid that has genuinely been rebuilt around renewable generation.
How clean is grid electricity now?
The carbon intensity of grid electricity is perhaps the clearest measure of how much has changed.
* Live snapshot taken 30 April 2026, 10:45am — a high-solar, high-wind period. Real-time data at grid.iamkate.com. Year-by-year figures are approximate annual averages derived from National Grid ESO data.
In 2012, the average carbon intensity of UK grid electricity was around 500g of CO₂ per kWh. The past year average now sits at 121g/kWh — a reduction of around 76% in under 15 years. On a high-renewable day it can fall below 40g/kWh.
This matters directly for anyone with solar panels. When your system exports surplus electricity to the grid, it displaces fossil fuel generation somewhere on the network. The cleaner the grid gets, the more that exported electricity is topping up an already clean supply rather than displacing gas. The environmental case for home solar gets stronger as the grid greens, not weaker.
But what about when the wind doesn’t blow?
This is the go-to objection, and it’s a fair one to raise. Renewables are variable. Solar doesn’t generate at night. Wind output drops during calm spells. Doesn’t that mean we still fundamentally need fossil fuels as a backstop?
The honest answer is: currently, yes, to a degree. Gas still plays a balancing role when renewable output drops, particularly during prolonged low-wind periods in winter. NESO is clear about this and doesn’t pretend otherwise.
But a few things are worth understanding about how this actually works in practice.
The grid has never relied on a single source. It has always been a mix. Gas fills gaps today the same way it did when it was supplementing nuclear and coal. The question isn’t whether one source can do everything, but whether the overall mix can reliably meet demand.
Storage is growing fast. The UK had just over 6 GWh of grid-scale battery storage on the system at the end of 2025, and that capacity is growing rapidly. Domestic batteries are part of this picture too and the potential scale is striking.
There are around 30 million grid-connected homes in the UK. If every one of them had a modest 2 kWh home battery, that would represent 60 GWh of distributed energy storage or roughly ten times the usable capacity of the current grid-scale battery fleet. Charged during off-peak hours when renewable generation is abundant and discharged during the evening demand peak, that distributed capacity could shift up to 6.9% of the UK’s average daily electricity demand from surplus periods into the hours the grid needs it most.
That figure is even more striking in context. At 10pm on a typical spring evening, gas is supplying around 6.9% of the UK’s electricity - almost exactly the share that 60 GWh of distributed home battery storage could displace. On nights like that, a fully-deployed fleet of home batteries could, in principle, push gas off the grid entirely. It wouldn’t eliminate the need for gas on the coldest, most demand-heavy winter nights, but it could make gas redundant for the majority of evenings across the year.
Larger systems like the Tesla Powerwall multiply that potential further. Storage shifts surplus renewable generation from periods of high output to periods of higher demand rather than wasting it. The home battery sitting in someone’s garage is as much a part of that solution as a grid-scale installation in a field.
Interconnectors provide flexibility. Britain is connected to France, the Netherlands, Belgium, Denmark, and Norway via undersea cables. When domestic generation is short, imports top up the difference. When we have surplus, as on that negative-price morning in April 2026, we export.
Wind and solar partially offset each other. Solar peaks in summer afternoons; wind peaks in winter and overnight. They pull in different directions across the year, which helps smooth the overall variability of the renewable mix.
None of this means intermittency isn’t a challenge; it is, and grid operators take it seriously. But it’s an engineering challenge being actively solved, not a fundamental barrier that makes the whole project impossible.
Records that would have seemed unbelievable a decade ago
Sometimes a single data point cuts through the noise better than a trend chart.
On 1 April 2025, NESO operated the GB transmission grid at 97.7% zero-carbon generation for half an hour - a new record. On 4 July 2025, total renewable generation peaked at 31,300 MW, meeting 84% of demand. GB ran on 100% clean power, after accounting for exports, for a record 87 hours across 2025.
These aren’t projections or modelling outputs. They are things that happened on the real grid, powering real homes and businesses.
The direction of travel
Renewable capacity in the UK stood at 65.1 GW at the end of 2025, up from just 9.3 GW in 2010. Solar generation grew by more than a third in a single year. The government has a target of 45–47 GW of solar by 2030.
The trajectory isn’t ambiguous. Renewables are already the dominant source of the UK’s electricity, are growing quickly, and backed by a pipeline of approved projects that will continue that growth into the next decade.
The argument that they can’t power Britain is one you’ll continue to hear, but the grid stopped waiting for that debate to be resolved and it just got on with it.
You can see the live and historical picture for yourself at grid.iamkate.com — updated every half hour, every day.
Curious how your own solar panels fit into this picture? Our Solar Generation Estimator shows you how much electricity your system could generate each month of the year.