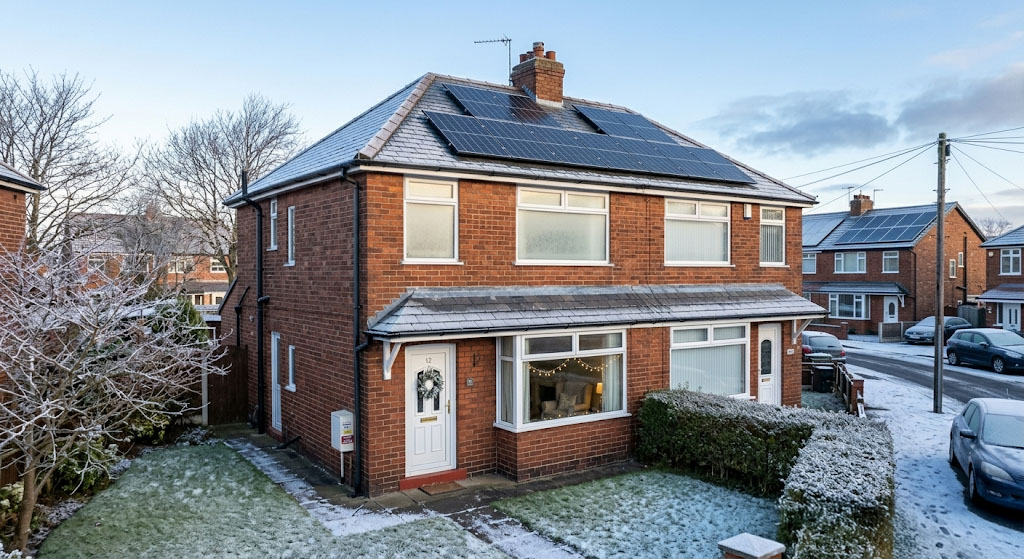
Winter is the season that makes UK solar sceptics feel vindicated. We have shorter days, grey skies, and a sun that barely clears the rooftops. It’s easy to assume that solar panels are doing nothing useful from October through to February.
The reality is that things aren’t always so clear-cut as winter generation is genuinely low, but low doesn’t mean it’s not worthwhile. The key is to understand the broader view of how solar fits into the your home energy strategy.
Let’s take a look at some real generation data from my own 4.89kWp system installed in the UK, covering a full annual cycle from April 2025 to March 2026. No estimates, no theoretical figures, just what actually came off the roof.
The numbers: a full year of real generation
Here is the raw monthly output from my system.
| Month | kWh | kWh per kWp |
|---|---|---|
| Apr 2025 | 473 | 96.7 |
| May 2025 | 547 | 111.9 |
| Jun 2025 | 578 | 118.2 |
| Jul 2025 | 559 | 114.3 |
| Aug 2025 | 494 | 101.0 |
| Sep 2025 | 347 | 70.9 |
| Oct 2025 | 167 | 34.2 |
| Nov 2025 | 117 | 23.9 |
| Dec 2025 | 68 | 13.9 |
| Jan 2026 | 84 | 17.1 |
| Feb 2026 | 118 | 24.1 |
| Mar 2026 | 317 | 64.8 |
The kWh per kWp column is useful if your system is a different size as it lets you scale these figures proportionally.
The headline number: December produced just 68 kWh, compared to 578 kWh in June. That is a ratio of roughly 1:8.5 between the worst and best months.
The annual generation curve
The winter dip is stark, but so is the recovery. Notice February to March: output nearly triples in a single month, from 118 kWh to 317 kWh. That transition happens fast. By April the system is already producing at roughly 80% of peak summer levels.
This matters for how you think about the year as a whole. The four winter months (November through February) produced a combined 386 kWh — about 10% of the full-year total. The four peak months (May through August) produced 2,178 kWh, or roughly 56% of the year.
Why winter output is so much lower
Two factors combine to make winter generation so much weaker than summer.
Day length. In London, the June solstice gives around 16.5 hours between sunrise and sunset. The December solstice gives just 7.8 hours. That alone halves the available generation window before anything else is considered.
Sun angle. In June, the sun reaches about 62 degrees above the horizon at solar noon in the UK. In December, that drops to around 15 degrees. A low sun angle means solar radiation hits the panels at a shallow angle, reducing the effective irradiance they receive — similar to the difference between looking directly at a light versus looking at it from the side.
Cloud cover compounds both of these effects. Panels do generate in overcast conditions (diffuse light still carries energy), but output can be 70-80% lower on a heavily overcast day versus a clear one.
Per kWp: how does this compare to any system?
Normalising against system size makes these numbers useful regardless of how large your array is.
For a south-facing solar PV system in the north of England, the expected range is roughly 900-1,000 kWh per kWp annually. Systems in the south of England can reach 1,050-1,100 kWh per kWp, while Scotland sits at the lower end around 850-900 kWh per kWp.
The full-year figure from my system (April 2025 to March 2026) comes out at approximately 881 kWh per kWp, which sits comfortably within that expected range for a south-facing roof in the north of England.
If your installer quoted you a figure in this range, winter is not evidence that they were wrong, it’s the expected shape of UK solar output.
What actually hurts winter output (beyond the obvious)
Panel soiling. Autumn leaves, moss, bird activity, and general atmospheric deposits all build up over winter. A dirty panel can lose 5-15% of its output. A good rinse with clean water in late autumn and again in February is worth doing especially if the panels are set to a shallow pitch which makes rainwater less effective at cleaning them.
Shading from low sun paths. Trees, chimneys, and neighbouring rooflines that cast no shadow in summer can cause significant shading in winter because the sun travels so low across the sky. If you have trees to the south that you planted after installation, it is worth checking whether they are now shading your panels during the key midday window.
Temperature (the counterintuitive one). Solar panels actually perform better in cold temperatures than hot ones. A cold, clear January day can deliver surprisingly good output. I saw a peak of 7.9kWh in January 2026 - way above the 2.7kWh average for the month. The best single days in winter come from bright frosty mornings rather than mild overcast ones. Cold clarity beats warm haze.
Managing expectations versus annual ROI
The temptation is to check your monitoring app on a grey January day, see 2 kWh for the day, and feel like the system is not working. It is working, but it’s just that December and January are genuinely bad months for solar in the UK, and that should be baked into every reputable installer’s annual yield estimates.
The right frame is the annual total, not any given month. A system that produces 4,300 kWh per year is doing its job whether or not it managed 68 kWh in December.
When reviewing payback period calculations, check whether your installer used a monthly or seasonal generation profile. Most reputable tools do - they’ll show summer peaks and winter troughs built into the model. If your installer gave you a single flat monthly average, that is a red flag as the real shape of generation matters for calculating your actual self-consumption rate.
Practical winter tips
Clean the panels. Once in November, once in February. You do not need specialist equipment. A soft brush on a long handle and clean water is enough for most domestic systems.
Watch the monitoring, but do not obsess over it. A useful benchmark: if you suspect your system to be underperforming on a clear December day then it’s worth investigating. Significant underperformance relative to expected output for the conditions is when you should act. Don’t just act on low numbers on a grey day.
Adjust your consumption habits. Run dishwashers and washing machines during the middle of the day in winter when solar output peaks around noon. Even in December, the midday hours are when you are most likely to be self-consuming solar rather than importing.
Note the February transition. February is when UK solar starts to meaningfully recover. Output roughly doubles from December to February, and doubles again from February to April. If you are considering adding more panels or a battery, the spring transition period is a useful time to review your monitoring data and see where the gaps are.
The bottom line
Winter solar output in the UK is genuinely low. If someone told you solar panels would be virtually useless from November to January, they were not far wrong on pure generation numbers alone.
But that’s a narrow way to look at it. Those winter months account for a small fraction of your annual yield, and a well-designed system sized correctly for your consumption will still be making a meaningful dent in your bills across the full year. The economics of solar are built around annual averages, not December.
The spring recovery is faster than most people expect. And once you have lived through one winter with panels, the second one feels very different as you know exactly what is coming, and you know what comes after it.