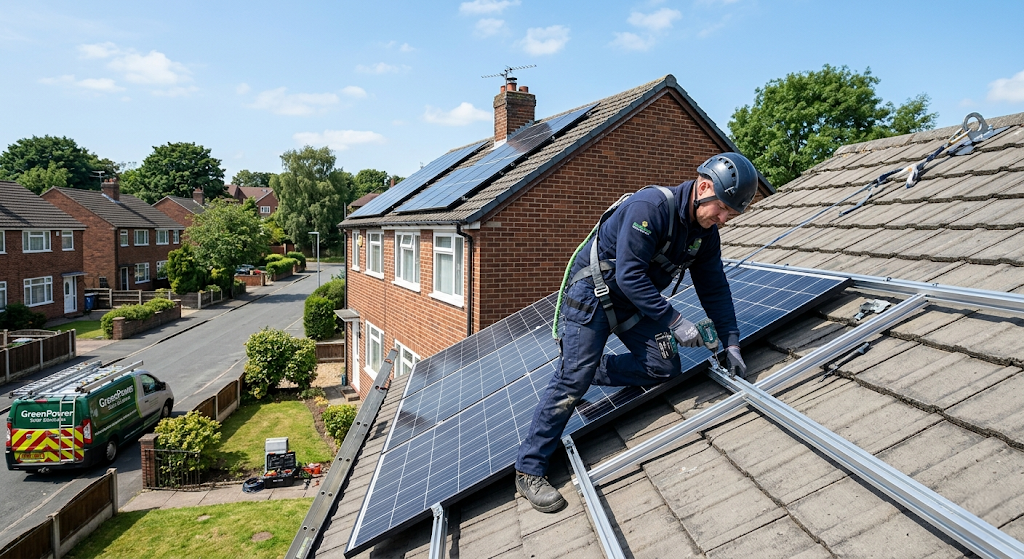
If you’re trying to understand whether solar makes financial sense for your home, one of the most useful starting points is knowing what everybody else is actually installing. Not the theoretical maximum your roof could accommodate, or the aspirational system a sales brochure might recommend, but the typical, real-world installation that most UK homeowners are going for in 2026.
The data from the Microgeneration Certification Scheme (MCS), the body that certifies installations and tracks every registered domestic system in the UK, gives a clear indication of what that typical installation is and you may be surprised how it tells a different story to older advice still circulating online.
The typical installation: bigger than you might expect
For a long time, the recommendation in UK solar circles was that 4 kWp was the sweet spot for a domestic system. That was based partly on old Feed-in Tariff rules (which paid a lower rate above 4 kWp) and partly on the limitations of older, less powerful panels.
Neither of those constraints applies any more. The Feed-in Tariff closed to new applicants in 2019 and modern solar panels have become significantly more powerful with a typical panel today producing around 420-450W, compared to 250-300W a decade ago.
The result is that average system sizes have been growing steadily, even though the number of panels per roof has stayed roughly the same.
System sizes have grown as panel wattage has increased — the number of panels per installation has remained roughly stable at 10–12, but individual panel power has risen from ~350W to ~450W. Source: Sunsave analysis of Ofgem SEG data.
According to MCS data, the average size of a domestic solar panel system in the UK in 2024 was 4.6 kWp. A separate Ofgem analysis puts the 2024 figure slightly higher, at 5.5 kWp. The difference reflects different datasets and definitions, but both point in the same direction: the typical UK system today is a 4.5-5.5 kWp array, made up of 10-12 panels at around 420-450W each.
For a south-facing roof at a 30° pitch in the Midlands, that generates roughly 3,900-4,700 kWh per year.
Who is installing solar, and is a battery included?
As of March 2026, the UK had crossed 2 million total solar installations, with around 22.1 GW of installed capacity, according to provisional data from the Department for Energy Security and Net Zero (DESNZ). The bulk of these installations are domestic rooftop systems, putting the number of UK homes with solar panels at roughly 1.7 to 1.8 million, or around 5.7% to 6% of all households. Total UK solar capacity grew by 11.7% over the 12 months to March 2026.
The question of whether to add a battery is where things get more varied. Battery storage has seen rapid growth, driven by falling battery prices, the rise of time-of-use electricity tariffs, and growing awareness of the arbitrage opportunity those tariffs offer. However, batteries are still more common as an add-on to an existing system than as part of a first installation, partly because of the additional upfront cost.
The most common first installation in the UK today is still solar panels only, but the share of installations including battery storage is growing year on year.
WWhat does the median household actually use?
Before looking at what a solar system can do for your bills, it helps to be clear about what a typical home consumes.
The official benchmark used by Ofgem for a medium-usage household is currently 2,700 kWh of electricity per year. This is the Typical Domestic Consumption Value (TDCV) used to calculate the quarterly price cap and to give customers a consistent reference point when their own usage is not known. The figure applies to households on this benchmark from October 2023 through to the end of June 2026, after which Ofgem will reduce it again to 2,500 kWh per year, reflecting continued falls in average household consumption.
This 2,700 kWh figure represents a medium-usage household, typically a 2-3 bedroom home with 2-3 occupants. Larger households or homes with electric heating will use considerably more; smaller households or those with gas heating may use less. For the purposes of sizing a solar system, 2,700 kWh is the most useful and widely cited reference point.
This is important for solar sizing, because it means a 4.6 kWp system that generates around 3,900 kWh annually can, in theory, cover more than 100% of a median household’s annual electricity needs. The catch, of course, is timing.
The timing problem: what the seasonal picture looks like
A solar system doesn’t generate electricity evenly across the year. It generates a lot in summer and very little in winter. Your household, meanwhile, uses more electricity in winter and less in summer. These two curves work against each other.
Generation estimates assume a performance ratio of 0.85 and UK average irradiance of 1,000 kWh/kWp/year, distributed using PVGIS monthly factors for a south-facing 30° pitch. Household consumption based on Ofgem's typical domestic consumption value (medium household, 2,700 kWh/yr) distributed across 12 months using ONS seasonal demand patterns. Actual results vary by location, roof orientation, and occupancy.
In June, a typical 4.6 kWp system in the UK Midlands generates around 490 kWh, well above the 160 kWh or so a typical household uses in the same month. In December, the same system generates about 100 kWh, while consumption climbs to around 280 kWh.
This seasonal mismatch is the core challenge of solar. The panels generate most when you need it least, and least when you need it most. There are two main responses to this:
Without a battery, you use whatever your panels are generating at the moment it is generated, typically 40-50% of annual output, depending on occupancy and daytime habits. The rest is exported to the grid under the Smart Export Guarantee (SEG).
With a battery, you can store the day’s surplus for the evening. Self-consumption rates typically rise to 70-80%, which cuts the amount you buy back from the grid and reduces your dependence on export income.
Neither approach solves the winter problem entirely. Even a well-designed solar-plus-battery system in the UK will draw meaningfully from the grid in the shoulder months from October through February. Solar reduces your annual bill, but it doesn’t get rid of it entirely.
An essential accompaniment to any installation is having appropriate import and export tariffs available to maximise the benefits. Typically, the lowest import rates are provided through EV tariffs which have overnight or scheduled periods throughout the day when electricity is at its cheapest. These EV tariffs may include strict eligibility criteria on having an EV and/or compatible charger so those households without may be excluded.
What does it cost and when does it pay back?
Costs based on DESNZ/MCS certified installation data. Bill savings calculated at Ofgem Q2 2026 price cap (24.67p/kWh). SEG export income assumes 9–12p/kWh average rate. Self-consumption figures assume a household with typical daytime occupancy. Individual results vary significantly with location, roof orientation, usage patterns, and tariff choice.
The costs and payback figures above are based on DESNZ/MCS certified installation data and the Ofgem Q2 2026 electricity price cap of 24.67p/kWh.
A few things are worth pulling out of those numbers.
The solar-only case is genuinely good value. A 4-5 kWp system costing around £7,000 and saving £700-£900 per year pays for itself in around 8-10 years. With panels warrantied for 25-30 years, that leaves 15-20 years of net return, equivalent to several times the original investment over the system’s lifetime.
Batteries improve your self-sufficiency but extend the payback. A battery adds £3,000-£6,000 to the upfront cost and increases annual savings by roughly £150-£200 at current electricity prices. At those numbers, the battery alone takes a long time to pay for itself. The case for a battery is stronger if you are rarely home during the day, if you are on a time-of-use tariff that rewards overnight charging, or if energy resilience matters to you.
0% VAT is a significant benefit, but it expires. Both solar panels and battery storage currently attract 0% VAT until 31 March 2027. After that, VAT reverts to 5%. On a £10,000 system, that is a £500 difference, worth factoring into your timing if you are on the fence.
Location matters more than most people expect. A south-facing roof in Cornwall with no shading will generate around 15-20% more than the same system in Scotland. The payback period in the South West can be as short as 6-7 years; in northern Scotland, 9-12 years is more realistic.
What self-consumption rate should you assume?
The question of how much of your solar generation you actually use yourself (your self-consumption rate) has a bigger effect on the numbers than most people realise.
Without a battery, and if nobody is home during the day, self-consumption might be as low as 25-30%. The system is generating electricity while the house is empty, and most of it is being exported for around 10-15p/kWh, considerably less than the 24-27p/kWh you would pay to import during peak periods.
Shift the washing machine and dishwasher to run during peak solar hours and self-consumption improves noticeably. Add a battery and it can reach 70-80%. Add an EV and charge it during solar generation and you can push it higher still.
The most honest way to think about it: a solar-only system with nobody home during the day might save £400-£500 per year; the same system in a home with daytime occupancy might save £650-£800. Battery or not, the biggest gains come from using the electricity as it is generated.
Is it worth it?
For most UK homeowners with a southerly facing roof and no significant shading, the answer at current prices is yes, with reasonable expectations.
The investment case works most clearly when:
- You have a suitable roof (southerly facing, minimal shading, not a listed building)
- You plan to stay in the property for at least 8-10 years
- You can shift some daytime electricity use to solar generation hours
- You get at least 3 quotes from MCS-certified installers and compare them carefully It works less well when the battery is justified purely on financial grounds at current electricity prices: the maths is marginal, and most honest analyses show battery-alone payback periods that push against or beyond typical battery warranty terms.
That said, the numbers are not static. Electricity prices have risen significantly over the past decade and are expected to rise further as demand grows through EV and heat pump adoption. Every penny increase in the electricity price shortens the payback period for a solar system already installed. Buying your generation capacity now, at current costs, is in effect a hedge against future price rises.
Use our Solar Generation Estimator to see how much a system could generate on your specific roof, and our Solar ROI Calculator to model your personal payback figures.